
How to Track Visual Search in Google Search Console
Search Console · Visual search
How to Track Visual Search in Google Search Console
Measure image-initiated searches and check which landing pages they reach.
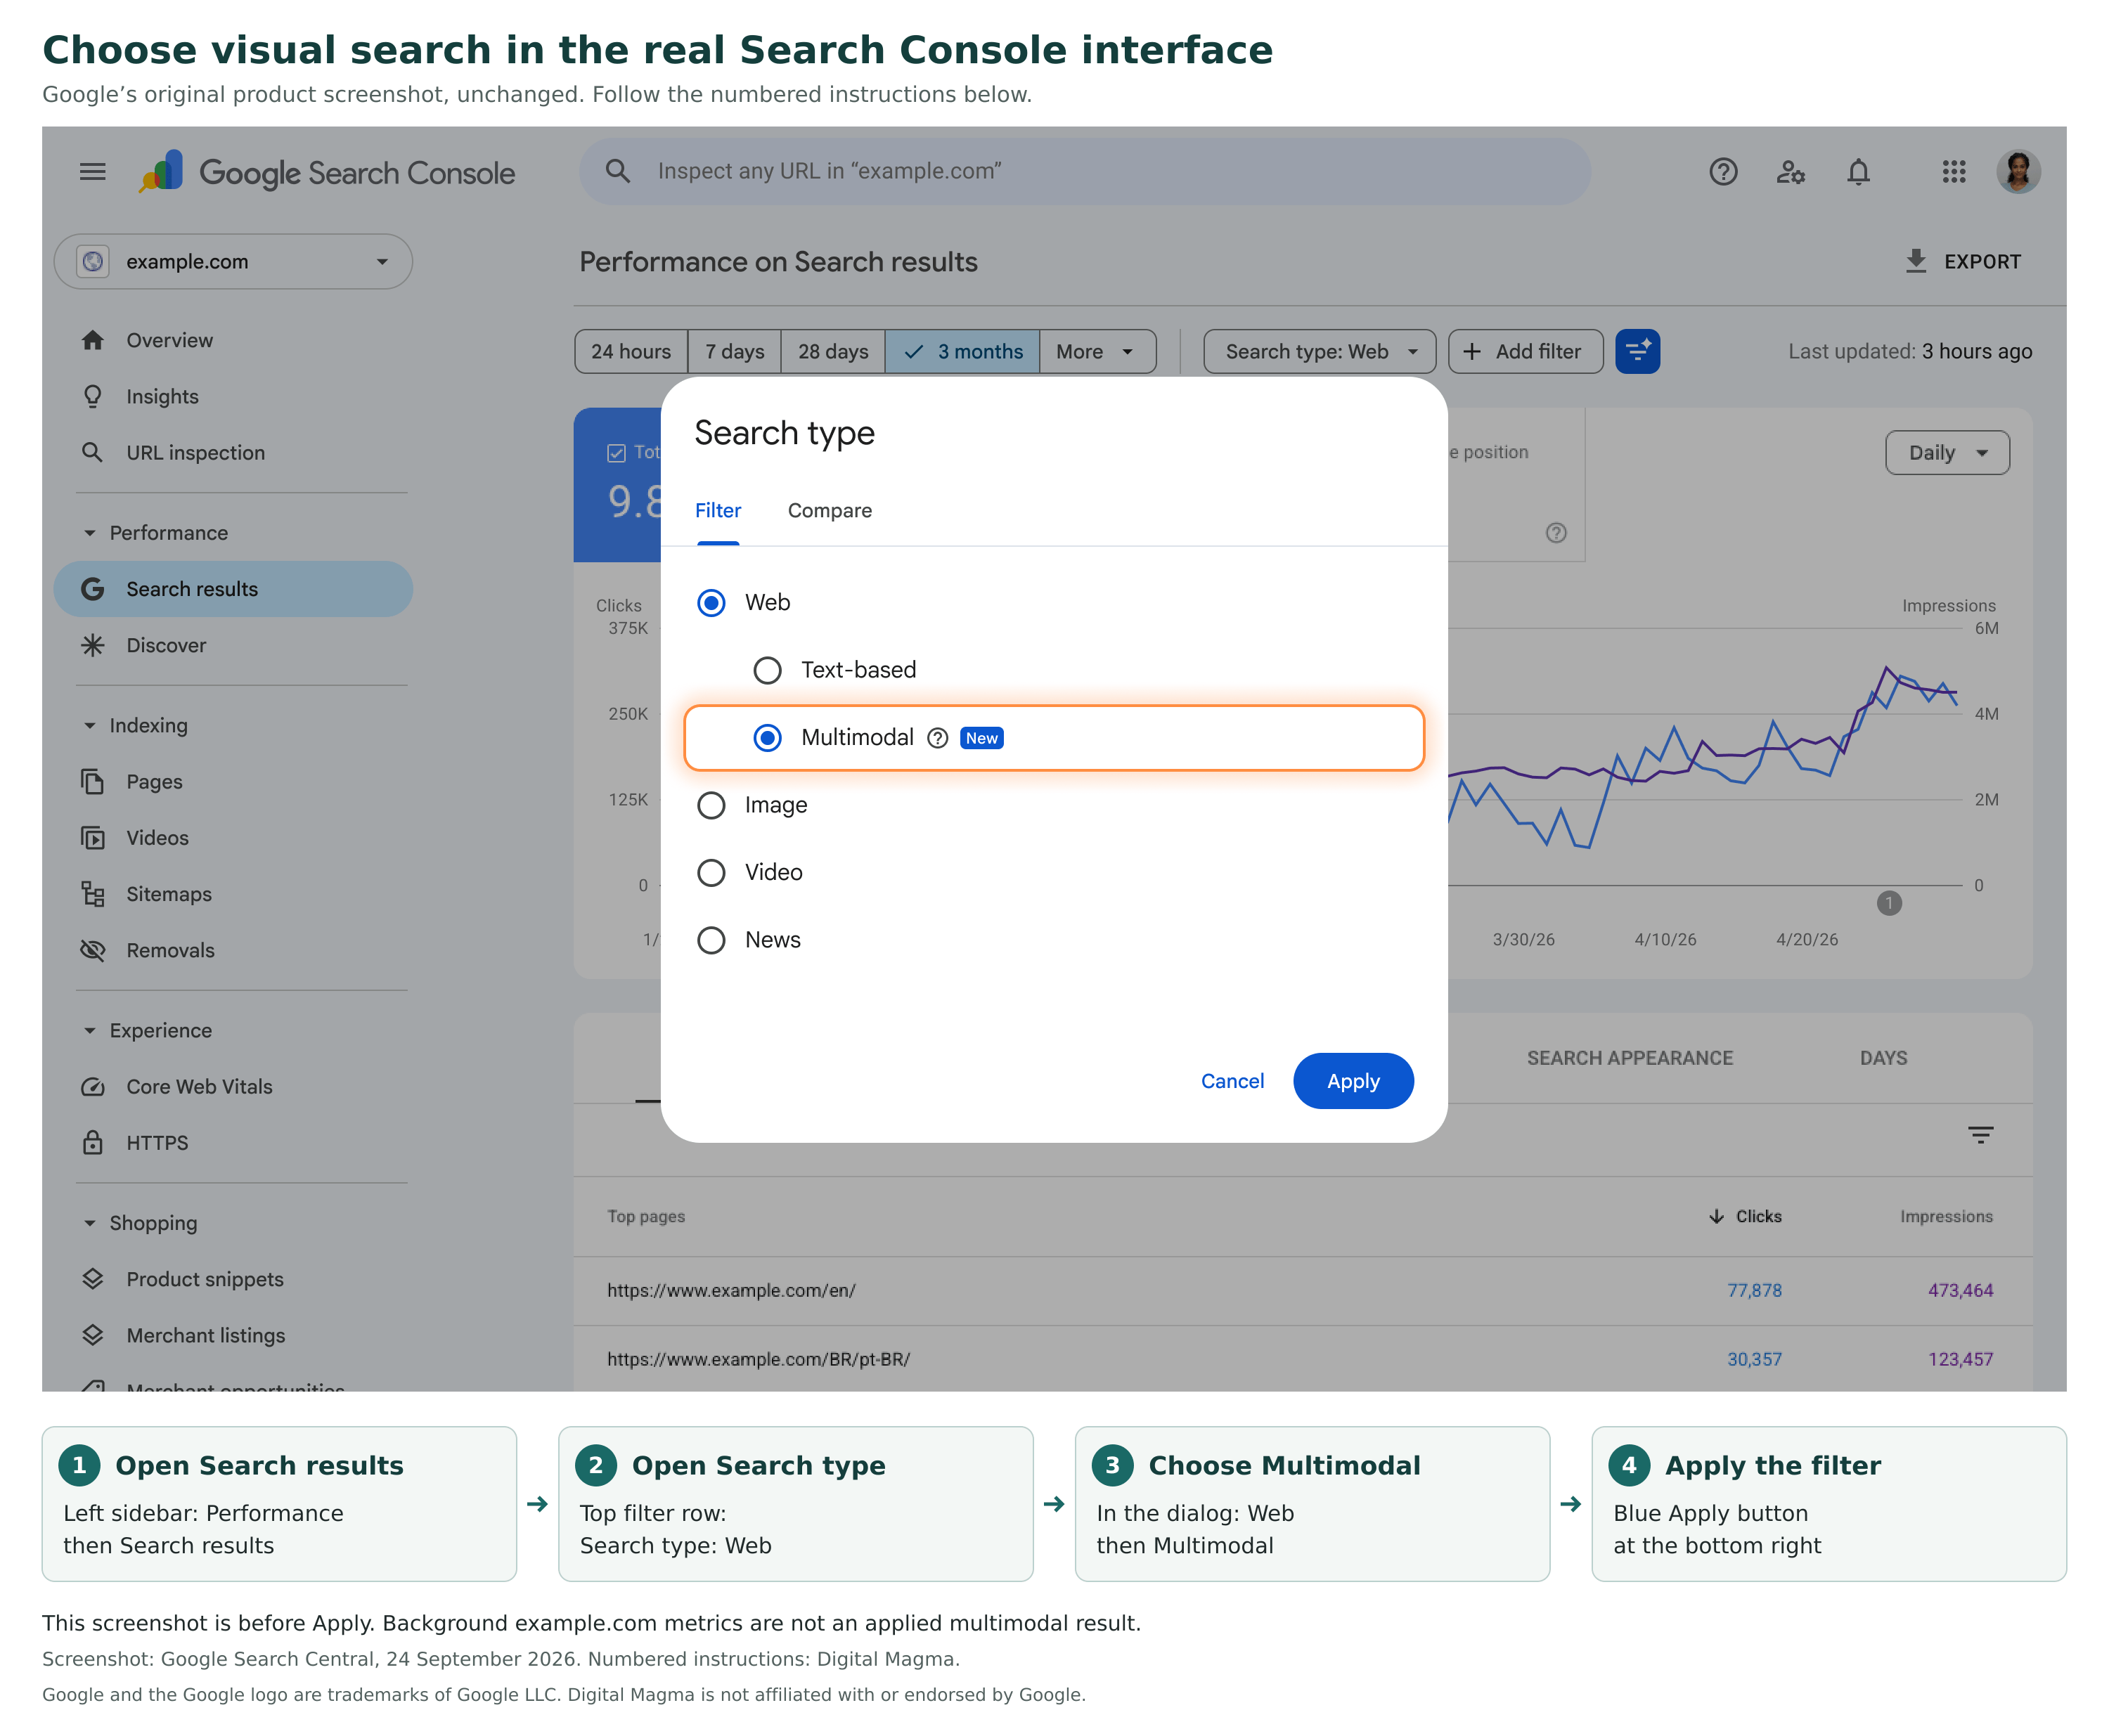
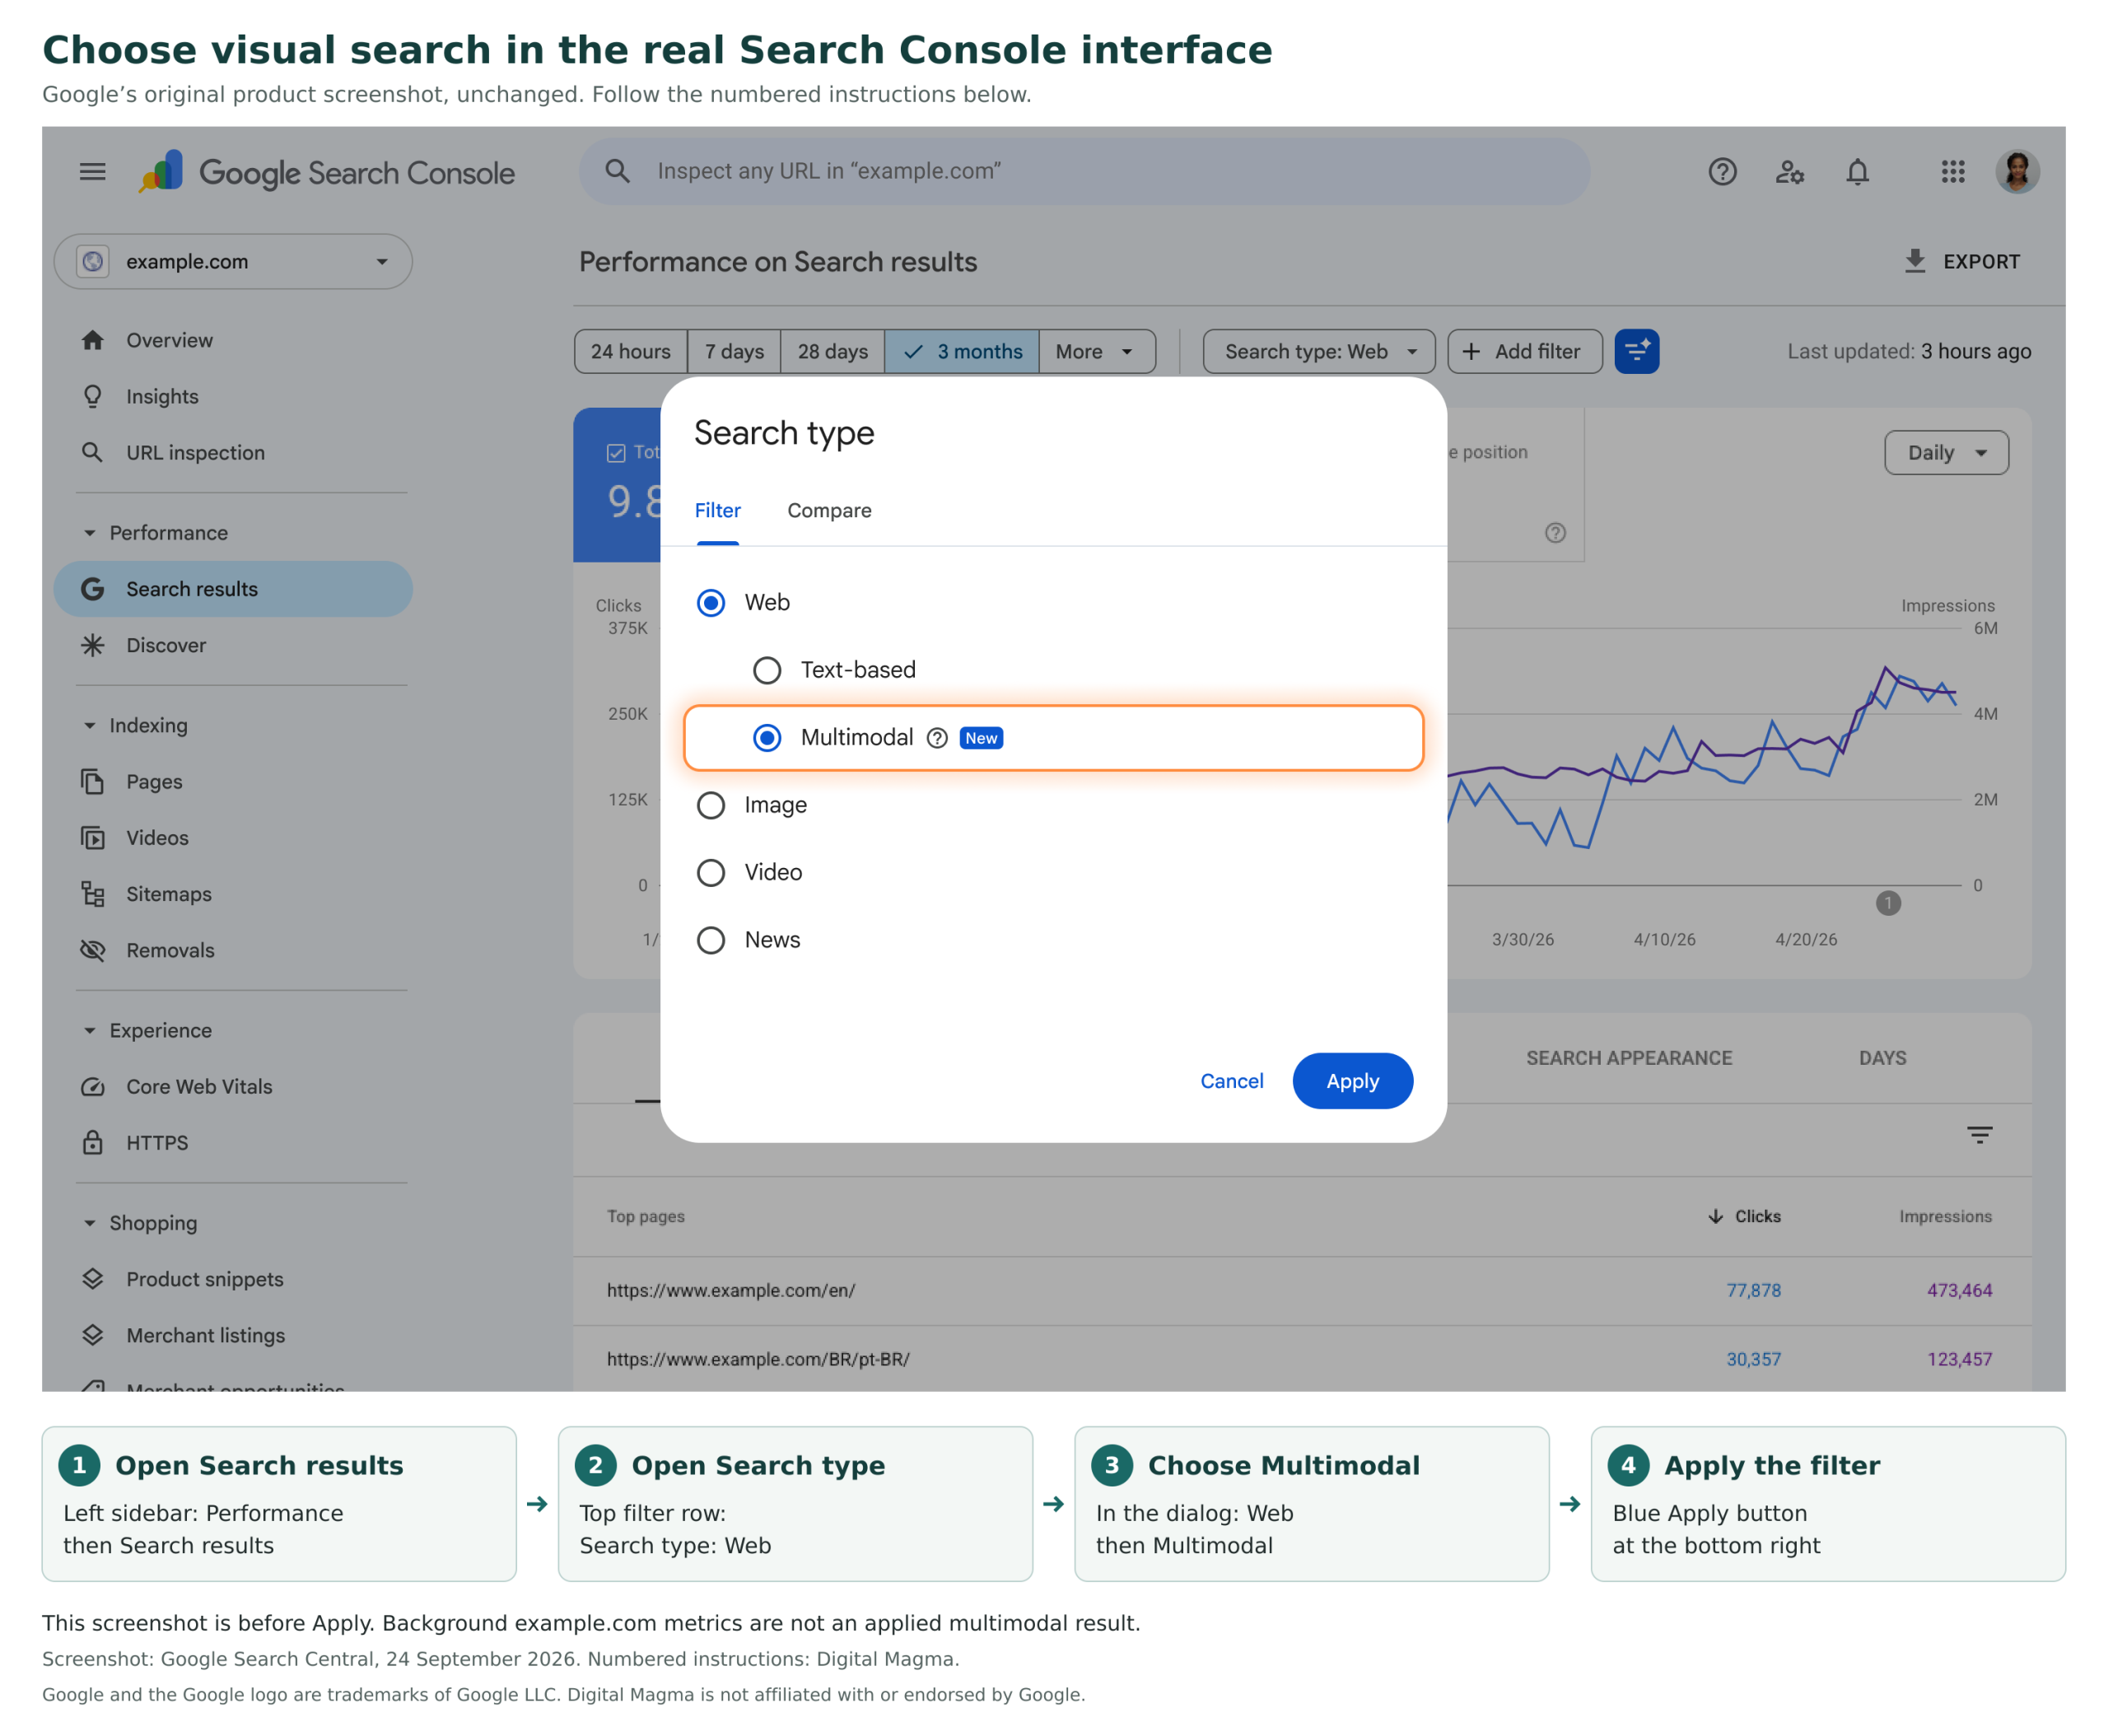
Open Search Console → Performance → Search results → Search type → Web → Multimodal → Apply. Read clicks, impressions and CTR; select Countries, then Pages to inspect landing pages. This combines supported image-initiated searches, including Lens; it does not isolate Lens.
What changed in Search Console?
Google announced Web: multimodal reporting on 24 September 2026, with a global rollout beginning that day. It covers searches started through Lens, Circle to Search on Android, image uploads to Google Search and Chrome’s image-search feature.
Web: multimodal and Image are different search types. Image measures results in the Google Images tab. Multimodal covers supported searches initiated with image input.
Set up the visual search report
- Choose your property and open Performance → Search results.
- Open Search type. Select Web → Multimodal, then click Apply. Check the active filter before reading the report.
- Set the date range. Use complete periods with enough activity for a useful comparison.
- Select clicks, impressions and CTR above the chart. Clicks count search-result clicks to your site; impressions measure appearances; CTR is clicks divided by impressions, multiplied by 100.
- Open Countries above the table and click a country you serve. This adds a country filter. Switch to Pages to see its reporting URLs. You can also use + Add filter.
- Export the view. Record the property, dates, country, device and search type alongside the file.
Google’s Performance report documentation and filtering instructions explain these controls.
Where to click
The screenshot below is Google’s published example. Its interface pixels are unchanged; Digital Magma added the numbered instructions beneath it. The dialog is shown before Apply, so the background chart is not an applied multimodal result.
Read the metrics together
Clicks can rise while CTR falls if impressions grow faster. Check counts, country and device mix, and sample size before treating a lower CTR as a problem. There is no universal CTR target.
A click is not a unique visitor or a sale. Use landing-page analytics and conversion records to assess outcomes, allowing for attribution gaps.
The Queries dimension is unavailable for Web: multimodal. Investigate pages and supported dimensions instead. Google’s export guidance also warns that “~” and “-” values can become zeros in downloads, so an exported zero may represent unavailable data.
Find country-level landing-page gaps
Start with one market you serve. Open its leading pages on a phone and check language, currency, availability, delivery coverage and the path to purchase or contact. Repeat for your next market with the same dates and device settings.
Search Console usually attributes performance to the canonical URL, which may differ from the URL visited. Check URL Inspection and available landing-page evidence before concluding that visitors reached the wrong localised page. Google explains this in its data-grouping guidance.
- Regional overview: select multiple countries for a combined total.
- Market-specific investigation: select one country, then open Pages.
- Side-by-side comparison: use the documented two-value comparison. A multi-country filter does not create separate series, and only one comparison is supported at a time.
The country dimension shows where a search originated. It does not establish nationality, preferred language or delivery address; verify those needs on the destination page.
For each priority URL, record the country, dates, clicks, impressions, CTR, verified page issue, proposed change and owner. Link the evidence so the next review can track what changed.
Decide what to fix
Impressions, but few clicks
Review the image, page title and relevance to the likely task. Is the item clear, and does the destination explain it? Check country, device and sample size before making broad changes. The metrics suggest where to investigate; they do not establish the cause.
Clicks reach a page that does not serve the market
Fix verified obstacles such as unclear delivery terms, unavailable products or an unusable mobile buying path. For localised sites, establish which version visitors reach before changing redirects, canonicals or hreflang.
One page receives most of the visibility
Compare it with other important pages. Look for differences in image clarity, discoverability and useful details such as dimensions, materials or use cases. Test a relevant improvement rather than copying the entire page.
Little or no data
- Confirm that the property covers the intended site or URL section.
- Remove page, country and device filters, then add them back one at a time.
- Try a longer complete period if activity is sparse.
- If indexing is a concern, use URL Inspection and check page and image accessibility separately. An empty performance report alone does not prove an indexing fault.
For a confirmed page-indexing issue, follow the crawled-but-not-indexed troubleshooting steps. If image-led discovery still produces little activity, prioritise better-evidenced problems.
Improve images and their landing pages
Use Google’s image SEO guidance as the foundation:
- Use clear, relevant images beside text that explains the subject.
- Make important images discoverable through HTML image elements. Google does not index CSS background images as images.
- Use descriptive filenames and contextual alt text, without keyword lists. Decorative images can have empty alt text.
- Compress images without obvious quality loss and provide responsive sizes. Set width and height to reserve space.
- Load the main above-the-fold image promptly; lazy-load suitable images farther down the page.
- Use a representative page image in metadata rather than a generic logo.
Product photographs should show the actual item. Put dimensions, materials, care and delivery information in the page text. After publishing, check that images load on mobile and that customers can read the details and complete the next step.
Structured data should match the page’s visible facts and purpose. For editorial articles, Google supports Article and BlogPosting markup with accurate headlines, authors, dates and representative images.
Keep AI reporting separate
For AI Overviews and AI Mode, use the Generative AI performance report. It reports impressions and supports text-based and multimodal filters; the current documentation does not provide AI-specific clicks or CTR.
Those impressions are already included in Search results Web data. Do not add the two reports together, or you will double count visibility. Neither report establishes a complete journey from an AI answer to a sale.
Review a change fairly
- Save the starting report. Record the URL, change, date and owner, plus relevant promotions, stock changes or site releases.
- Verify the live page. Check the image, text and buying path on mobile.
- Use the same report scope. Keep the property, search type, country, device and page filters consistent.
- Compare complete periods. Match their length and consider weekdays and seasonality. Sparse activity may need a longer observation window.
- Read clicks, impressions and CTR together. Check whether the page or market mix changed. Assess engagement and conversions separately.
- Separate observation from cause. An increase after an edit does not prove the edit caused it. Keep changes that remove verified customer obstacles, and revisit changes that harm usability or speed.
Search Console and analytics can differ because of aggregation, processing, privacy, timing and time zones. Keep the original exports and filters, and investigate large discrepancies using Google’s data-discrepancy guidance.
Google and the Google logo are trademarks of Google LLC. Digital Magma is not affiliated with or endorsed by Google.



Comments